You're doing prompt tracking wrong: your brand doesn't have one AI ranking, it has one per customer
11 June 2026 · Content
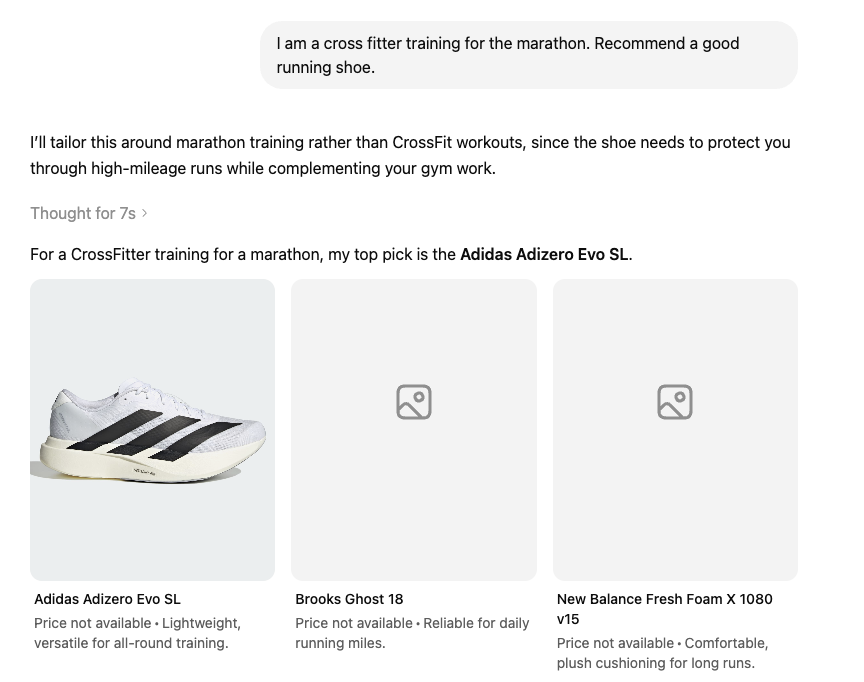
I asked ChatGPT to recommend a running shoe twice this morning. Same question, same model, same day. The only thing I changed was one sentence about who I was.
First I told it I was a CrossFitter training for a marathon. It recommended the Adidas Adizero Evo SL.
Then I told it I was a rock climber training for the London Marathon. It recommended the ASICS Novablast 5.
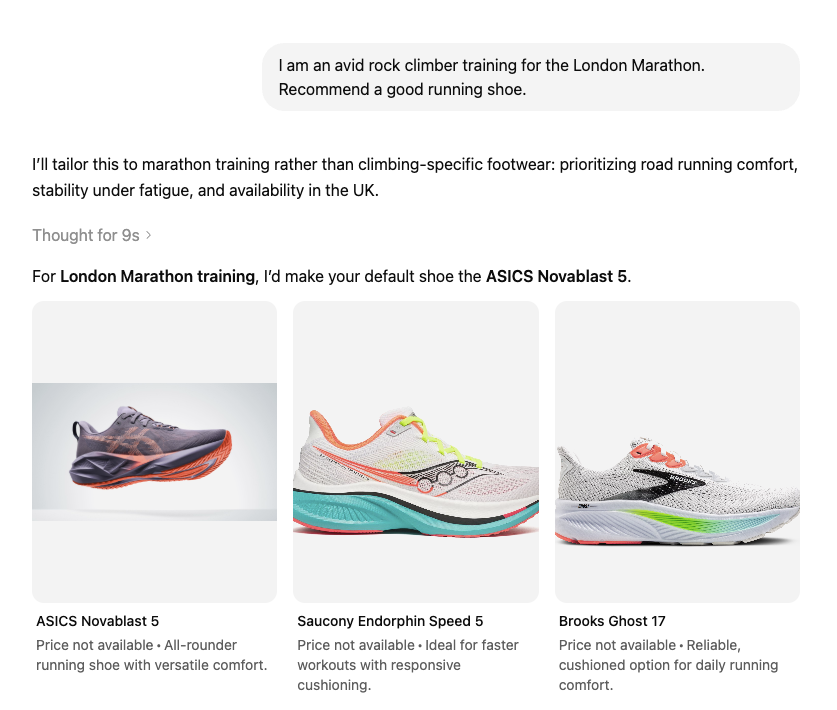
Different top pick. Different runners-up. Both lists included a Brooks Ghost, but the CrossFitter got the Ghost 18 and the climber got the Ghost 17. Not even the same version of the same shoe survived the persona change.
So I asked it to explain itself.

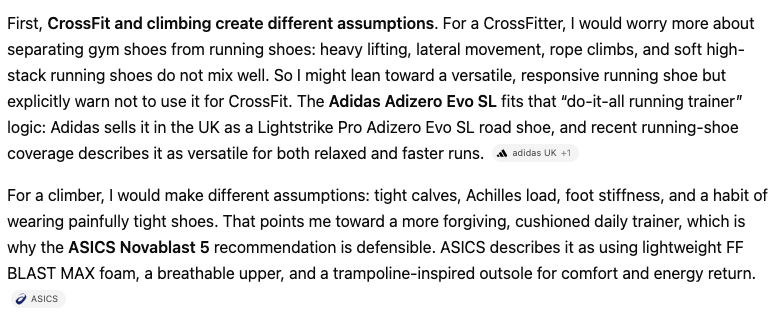
Look at that reasoning. For the CrossFitter, it worried about heavy lifting and lateral movement and picked a versatile shoe. For the climber, it assumed tight calves, loaded Achilles and a habit of wearing painfully tight shoes, so it chose something forgiving and cushioned. The model built a picture of the buyer first, then shopped for them.
This matters for one simple reason. If a single sentence about the buyer changes which brands get recommended, then your brand does not have one AI ranking. It has a different one for every type of customer who asks. And almost everyone measuring AI visibility right now is ignoring this.
“Every buyer gets a different answer. Knowing exactly who your buyer is just stopped being a marketing platitude and became a measurable advantage.”
The research that proves it isn’t just shoes
A research team at Unusual.ai recently put this to a proper test in a paper called Persona Conditioning of Brand Recommendations. Worth knowing they’re a vendor in this space, but the method is published in full and stands on its own.
The setup was simple. They wrote 10 buyer personas built from four attributes: industry, company size, job role and location. Each persona was just a sentence stuck on the front of the question, exactly like my trainer experiment (“I’m a procurement VP at a US enterprise…”). They ran 8 buying questions across B2B software and consumer categories, against OpenAI and Anthropic models, 2,000 runs in total.
Then they measured how much the recommended brands changed when only the persona changed. They call this the swap rate (the share of recommendations that get replaced when a different persona asks the same question).
The results, split by how famous the brand is. A quick translation of the tiers first, walked through a single niche so the ladder makes sense. Take accounting and payroll software, one of the paper’s two test categories. The category leader is QuickBooks: the default name, the one the model reaches for when it knows nothing else about you. The established challenger is a brand like Xero: still a name most buyers recognise, but it needs a reason (a UK buyer, a smaller firm) to displace the default. Mid-market brands sit below that: tools accountants in one lane rate highly, that nobody outside the lane has heard of. And regional players dominate one market and barely register elsewhere, like BrightPay in UK and Irish payroll, or sevDesk in Germany. The same ladder exists in every category. In CRM it runs Salesforce, then HubSpot, then down.
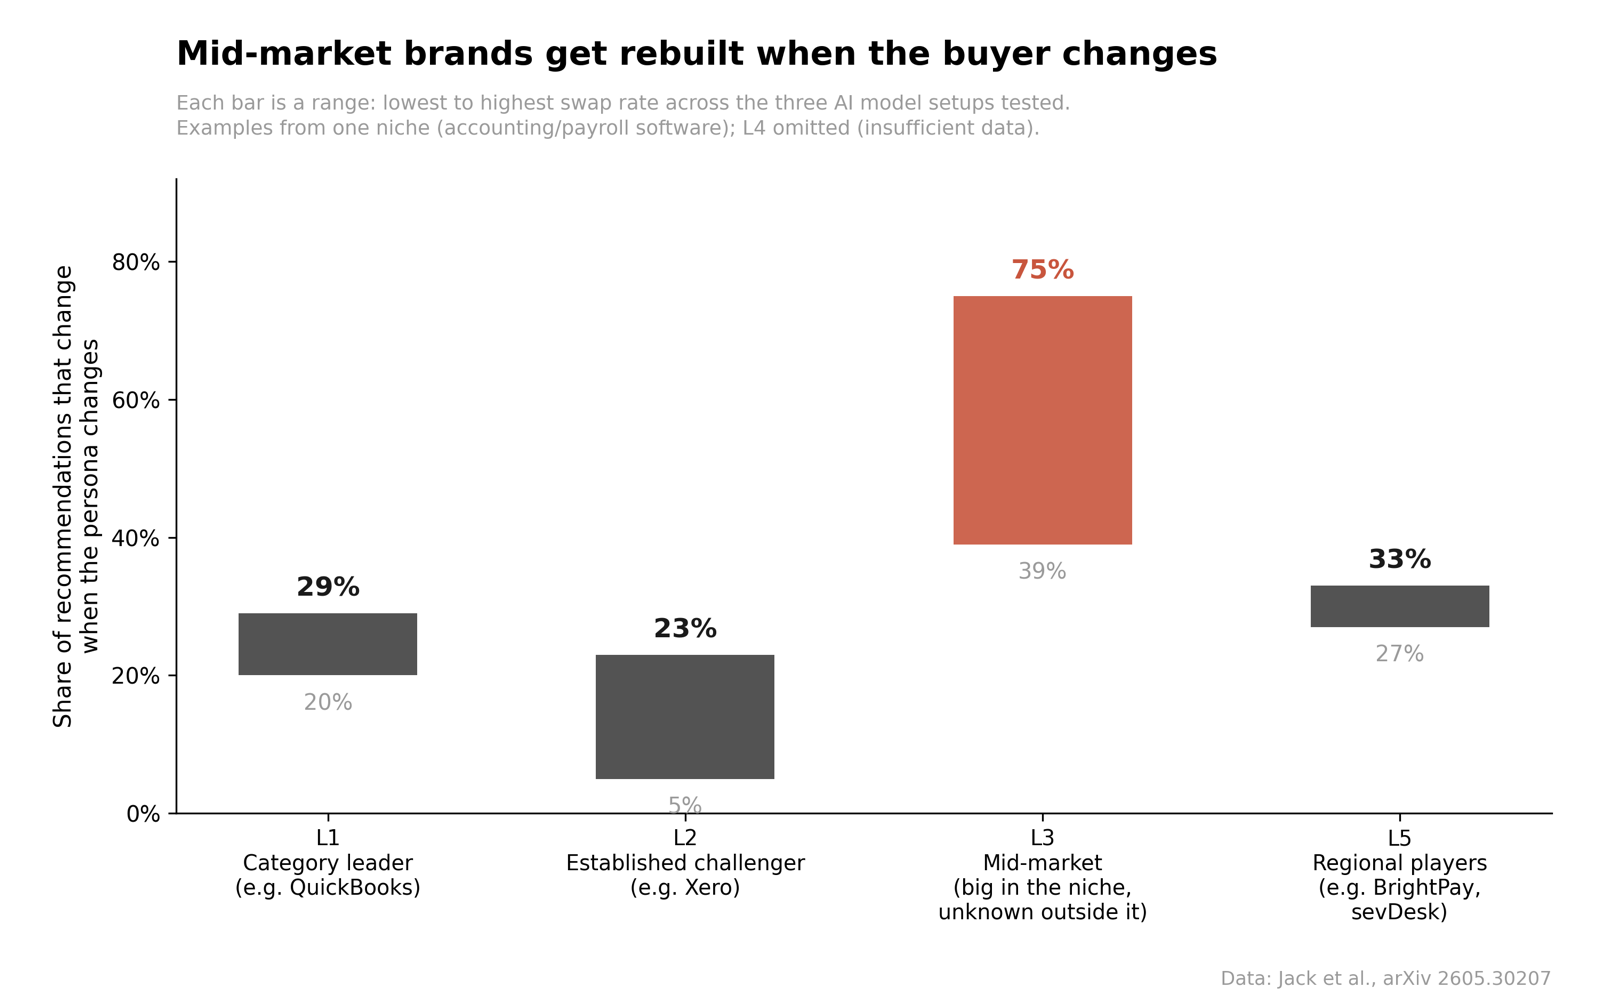
A note on reading the chart: the bars are ranges, not totals. The paper tested three model setups (two OpenAI, one Anthropic), and each produced a different swap rate, so each bar runs from the lowest result to the highest. Mid-market’s bar starts at 39% because that was the gentlest model, and tops out at 75% on the harshest.
Category leaders moved a bit (a 20 to 29% swap rate). Established challengers were the most stable. But mid-market brands got rebuilt almost entirely: up to 75% of their recommendations changed when the persona changed. If you’re well known in your niche but not a household name, the AI’s answer about your category is mostly a coin toss weighted by who’s asking.
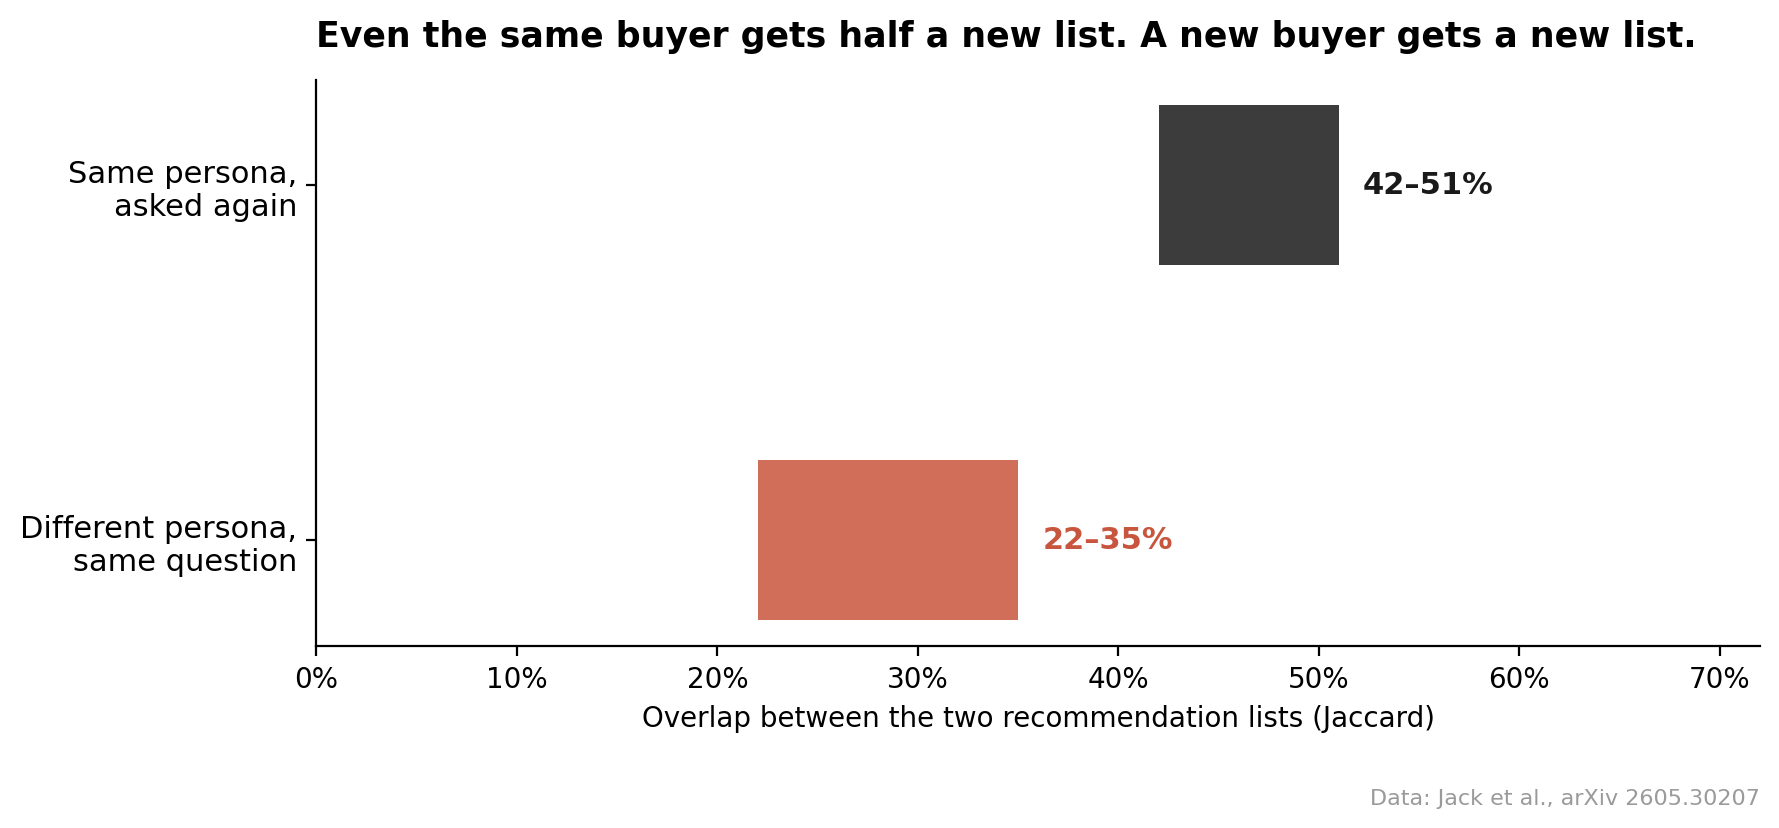
One more finding hiding in the paper, and it’s the one I’d pin to the wall. Even when the researchers kept the persona identical and just re-ran the same question, only around half the recommended brands stayed the same between runs. Change the persona and the overlap drops by another third.
What this means for your prompt tracking
Most AI visibility tracking today works like this: write a list of generic prompts (“best CRM for small business”), run them, record who got mentioned, report the movement.
That approach now has two problems.
First, the generic prompt measures a customer who doesn’t exist. Real buyers arrive with context, and ChatGPT and the other LLMs increasingly have that context anyway through memory (the picture they quietly build of you from everything you’ve asked before). In another test I ran with two friends, both asked the exact same question about the best restaurants for a trip to London. One is deep into fitness, and his answer leaned towards healthier spots. The other is a gamer whose chat history is mostly fast food, and he got a completely different list. Same prompt, word for word. Different people, different answer.
Your tracking tool, on the other hand, asks from a clean slate with no memory at all. Asking an LLM a bare question with no persona is like a shop assistant serving a customer wearing a bin bag. They’ll still recommend something. They’re just guessing who’s underneath.
Second, a single answer is a coin toss. If half the list changes when nothing changes, the difference between “we ranked 2nd” and “we vanished” can be pure noise.
Doesn’t my tracking tool already handle this?
Partly, and it’s worth being precise about what the tools do and don’t fix.
The mainstream prompt trackers (Profound, Peec, Otterly and friends) do rerun your prompts for you, usually once a day per prompt per platform, and chart the results over time. Ahrefs’ Brand Radar takes the opposite approach: instead of rerunning your handful of prompts, it samples your brand’s share across hundreds of millions of search-backed prompts. So the rerunning isn’t the gap. The gaps are in how the numbers get read and in what the prompts say.
Three things to check on whatever you use:
-
One run a day is still one sample. A second study, Quantifying Uncertainty in AI Visibility, re-ran identical prompts minutes apart and watched a brand’s share of citations swing by a factor of about 1.65 (whatever number one run gives you, the next can easily come back 65% higher, or a third lower, with nothing changing in the world). That random bounce is the noise. Your tool’s day-over-day and week-over-week movements are mostly that bounce, not real change. If your mention rate reads 12% on Tuesday and 17% on Friday, the most likely explanation is the dice, not your content. The monthly aggregate is the number worth reading, and a movement only becomes a trend when it holds for weeks across many prompts.
-
Prompt count matters more than rerun count. That same measurement study found topic-level numbers only settled once each topic was covered by roughly 40 to 150 different queries (40 on the most stable platform, 150 on the noisiest). Worth knowing how the researchers built those query sets: they had an LLM generate around 200 ways a buyer might ask about each topic, and they even kept the duplicates, reasoning that frequently generated questions are the frequently asked ones. The lesson is volume, not clever wording. In practice you’ll build that volume from two places. Different questions a buyer asks within the topic:
- “best office chair for back pain”
- “are expensive office chairs worth it”
- “what office chair do physios recommend”
And different phrasings of the same question:
- “best office chair”
- “recommend me an office chair”
- “what office chair should I get”
The paper doesn’t draw a line between the two, and you don’t need to either. Most people already track the first kind, but you’ll run out of genuinely different questions long before 40, so phrasings are how you get the rest of the way. They aren’t filler: the rerun data shows the answers change even when the words don’t, so each phrasing is simply another sample of a noisy answer.
-
Almost no tool adds personas for you. If yours does, it’s the exception. But the prompts are yours to write, and nothing stops you putting persona-prefixed prompts into the tool today. That one habit turns a generic tracker into a segmented one, at no extra cost beyond the prompt slots.
What this looks like in a real dashboard
Theory is easy to nod along to, so here’s the real thing. These charts are from our own tracking tool, for one of our clients (names changed, data untouched). The setup: 45 prompts, 5 AI models, refreshed weekly. So every step on these charts is one weekly sample of 225 answers.
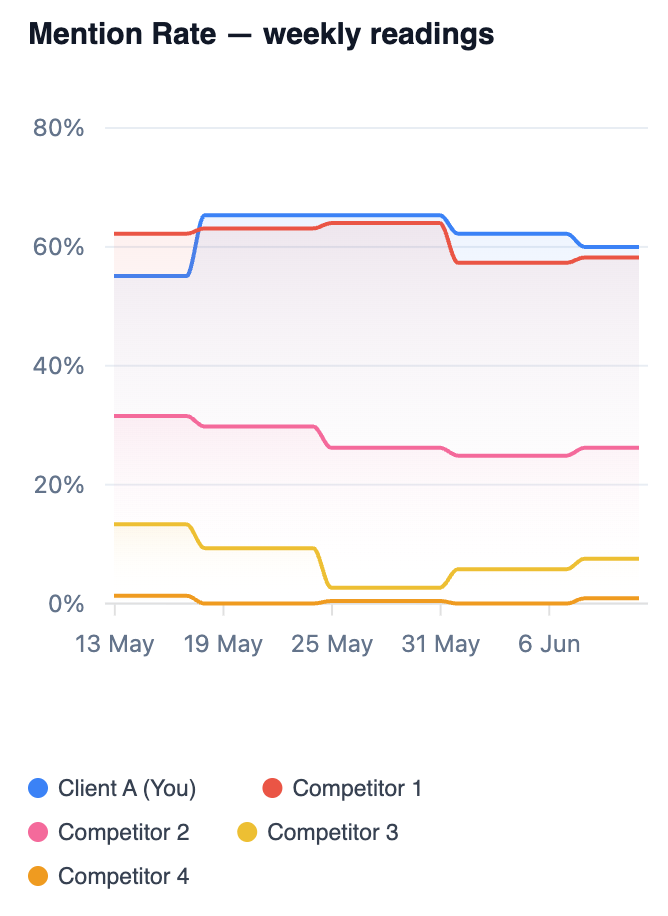
Look at the blue line (the client). It steps up around 17 May, drifts down around 1 June, ends roughly where it started. At this sample size, basic sampling maths puts a noise band of about ±6 percentage points around every weekly reading. The entire movement in that chart, top to bottom, fits inside the band. Nothing happened in this chart. Nobody published anything, nobody lost anything. The dice rolled.
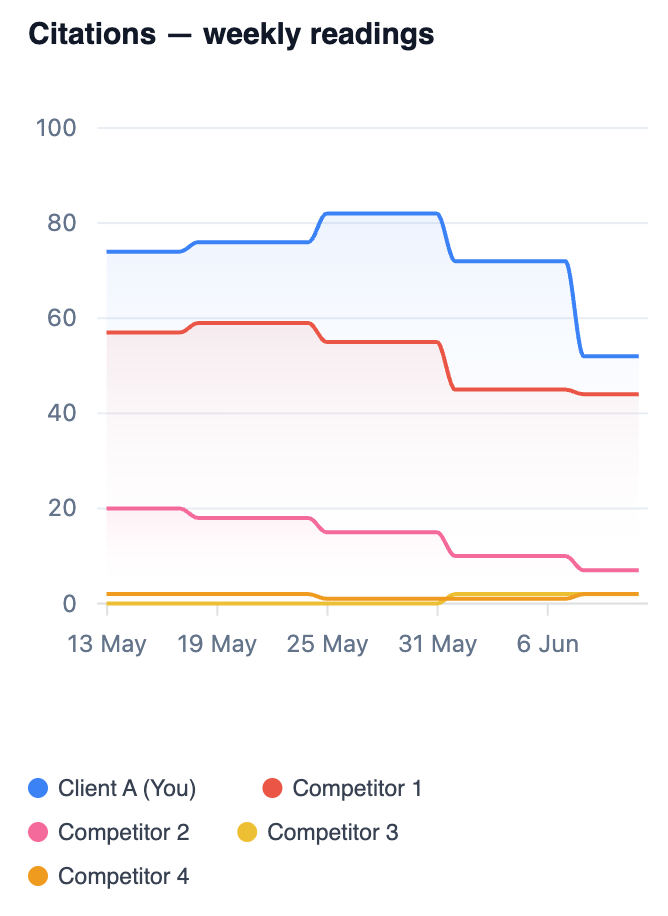
Citations are worse. This is the metric where the research found half the cited sources change between identical runs, and you can see it: the client’s line drops from around 80 to the high 50s with no change in the underlying content. On the dashboard’s front page this showed as a red arrow reading “down 22 vs 30 days ago”. A red arrow built on noise is how panicked Monday meetings happen.
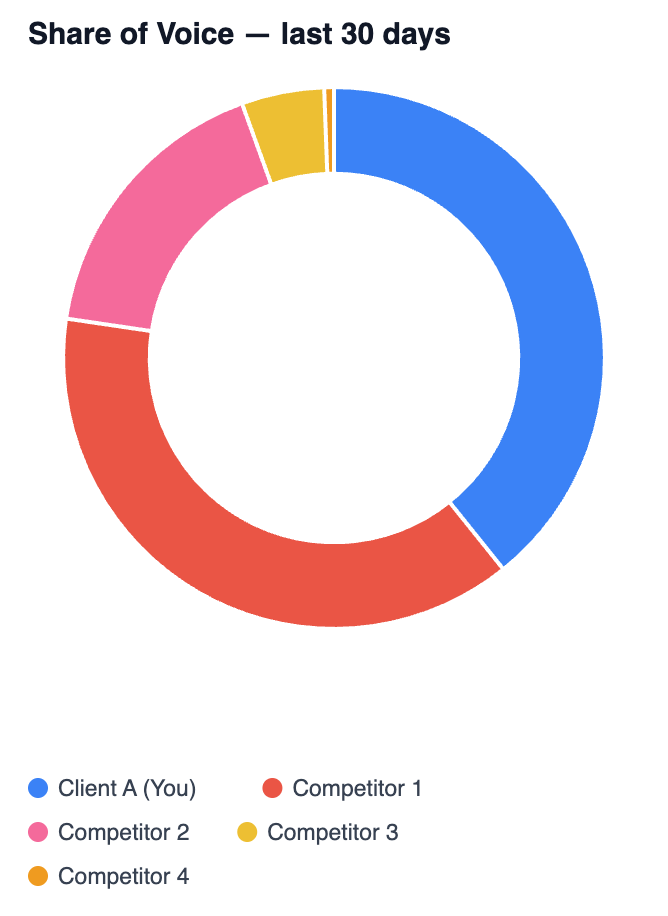
And the share of voice. The dashboard ranks Client A first on 39.24%, with the nearest competitor second on 38.08%. That 1.2-point gap is far inside the noise at this volume, so first versus second here is a coin toss, and reporting “we’re number one” off the back of it is writing cheques the data can’t cash. What is real: the gap to the third competitor on 17%, and the one at the bottom on half a percent. The rule that falls out of this: trust gaps that are multiples, not decimals.
None of this makes the tool useless, to be clear. The 30-day aggregates underneath (900 responses) are solid. The failure mode is reading the weekly wiggles as events. Same data, wrong zoom level.
Three ways to run this, by budget
The gold standard. This is roughly what the researchers did, and what we run at Snippet Digital for clients who treat AI visibility as a board-level number. Build three to five personas from your real customer segments, using the same four ingredients the paper used: industry, company size, role, location. Write 40 or more queries per commercial topic, because that’s the coverage the numbers needed before they stabilised. Prefix every query with every persona, rerun the whole matrix daily, and report monthly appearance rates per persona with a noise range around each number. Made concrete for a payroll software brand, that looks like:
- Personas: an accountant running a small UK practice, an in-house finance lead at a 50-person company, a bookkeeper serving sole traders, a US payroll manager.
- Topics: best payroll software, payroll for small businesses, switching payroll provider, payroll compliance.
- Volume: 4 personas times 4 topics times 40 queries = 640 prompts, rerun daily. Roughly 19,000 answers a month feeding the aggregates.
The measurement is honest and the results follow, because the content work that comes out of it is aimed at a buyer who actually exists. It’s also expensive. Personas times queries times reruns times platforms compounds quickly, whether you’re paying in API calls, tool prompt slots or analyst hours.
The middle of the road. Use the tracker you already pay for and spend its prompt slots deliberately. Two or three personas, your four or five most commercial topics, ten to fifteen queries per topic, persona sentence on the front of each one. The same payroll brand might run:
- Personas: the UK accountant and the in-house finance lead (the two segments worth the most).
- Topics: best payroll software, switching payroll provider, payroll for small businesses.
- Volume: 2 personas times 3 topics times 12 queries = 72 prompt slots, which fits a mid-tier plan on most trackers.
The tool’s daily reruns handle the repeats. You give up some statistical confidence on any single topic, but you keep the two things that matter most: persona segmentation, and enough query variety that you’re not reading three prompts as the truth.
The cheap version. One decision: pick your main persona and put it on the front of everything. One sentence describing your most valuable customer type (“I’m an accountant running a small UK practice”), prefixed to every prompt you track or test. There’s research support for going narrow. The paper found sharper, more specific personas produced tighter and more consistent recommendation sets. Vague buyers get vague answers. Specific buyers get specific answers, and specific answers are something you can optimise for. You’ll notice this is just marketing fundamentals wearing a new outfit. Knowing exactly who your customer is has been the job all along. The LLMs have simply started punishing the brands that never decided.
What the numbers mean, and what to do with them
Whichever tier you pick, you end up with the same core metric: the share of runs where your brand gets recommended, per persona, per topic. Here’s how to read it.
A gap between personas is a strategy signal. If you appear in 40% of runs for the ops director and 5% for the finance lead, the model has evidence connecting you to one buyer and nothing for the other. That isn’t a tracking quirk. It’s a content gap. Remember what ChatGPT did in my shoe experiment: it formed assumptions about the buyer, then looked for the product whose evidence matched those assumptions. If nothing you’ve published speaks to the finance lead’s assumptions, you don’t get the slot.
A movement within a persona is campaign feedback, but only at monthly scale. Sustained for weeks across many prompts: real, and worth attributing to whatever you shipped. A day-over-day move: noise. Ignore it.
When you find a persona you’re losing, ask the model why. Do what I did in the screenshots. Run the buying question as that persona, then ask it to explain its picks. It will tell you the assumptions it made and the evidence that swayed it. That’s your content brief, handed over for free. It is the same discipline as building content around specific audiences, only now the model writes the brief for you. Write the case study for that buyer type, build the comparison framed for that company size, earn the reviews and mentions in the places that buyer’s searches actually pull from. Then watch that persona’s number, monthly, against the others.
If you’re mid-market, the volatility is the opportunity. The big players are sticky. You’re not, in either direction. The brand that feeds the model persona-specific evidence is the brand it reaches for when that buyer asks.
Where I land
Stop asking “does my brand show up in ChatGPT?” Start asking “who does my brand show up for?” The first question has no answer. The model proved that the moment it gave my imaginary climber different shoes than my imaginary CrossFitter.
If you want help working out which personas matter and building the visibility plan around them, that’s what I do.